Have you already built your queries? Great, you're ready to visualise your data in a dashboard.
In this Guide:
Start by creating a Dashboard:
- Create an ID and name your dashboard
- Choose if you want to share with All Admins or just yourself
- Switch it from the Public to Private Dashboard so that you can work and edit before sharing
You can add Widgets by selecting from existing ones:

Or create your own:
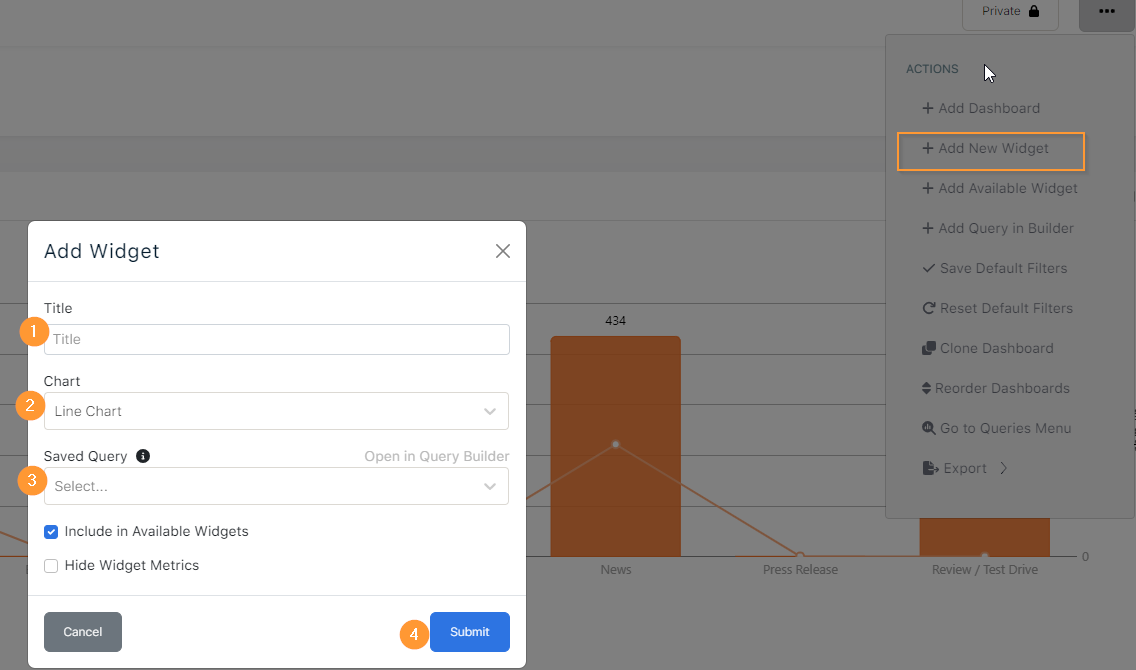
1- Name your Widget
2 - Select the type of chart from the Chart selection we have available:
-
- Infographic
- Note/Text
- Line Chart
- Area Chart
- Stacked Chart
- Horizontal Stacked
- Donut
- Pie
- Data Grid
- Article List
3- Find your query from the dropdown list
4- Save it and it will appear on your dashboard
Clone a Dashboard
if you choose to clone a dashboard, you can move it to your own Private Board, edit it and make it your own with multiple customizing options.
Dashboards once created can also be renamed: 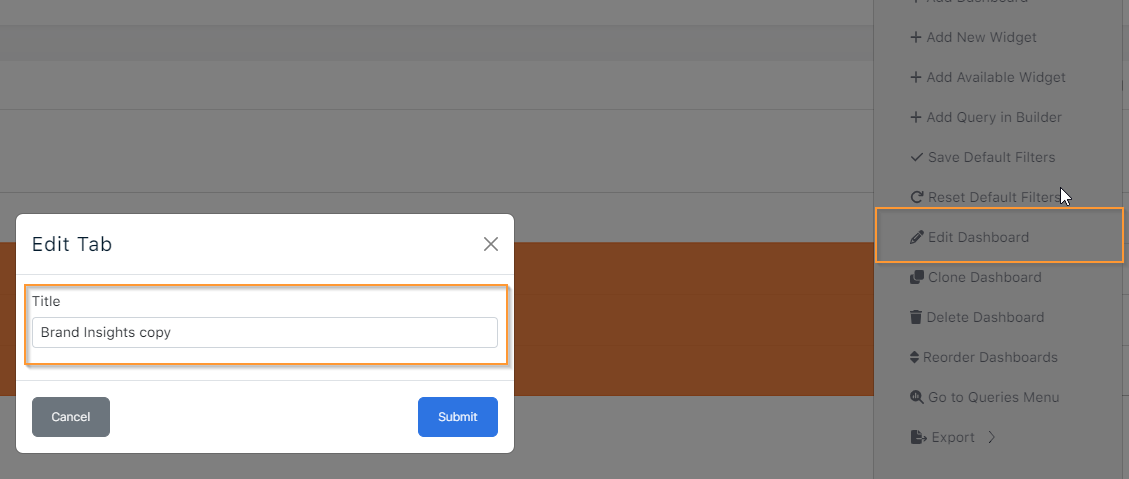
Or reordered, according to predefined parameters or as you prefer:
Editing a Widget
There are multiple options to Edit a Widget - rename, resize, delete, Show Data Values or Hide/Show Metrics.
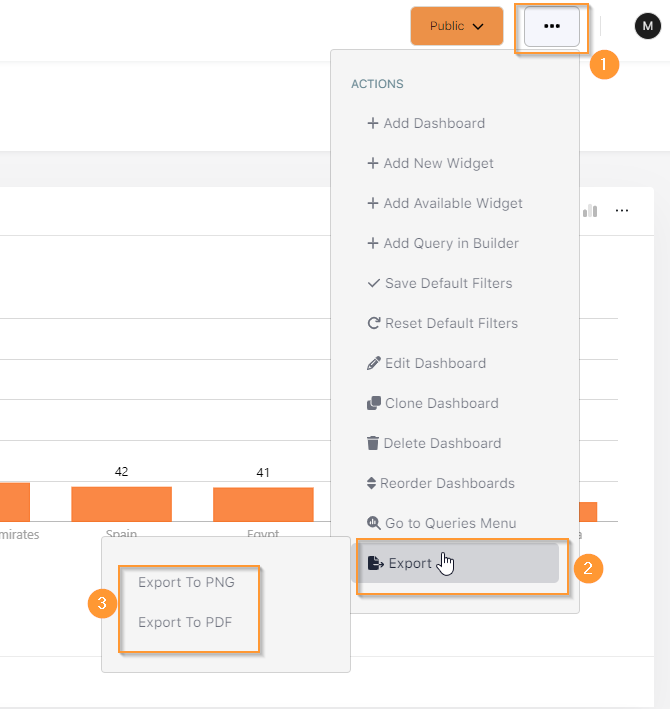
Exporting a Dashboard or a Widget
1 - Click the menu
2 - Select Export
3- Choose the format file
From a Dashboard, select the Menu from the top right corner:
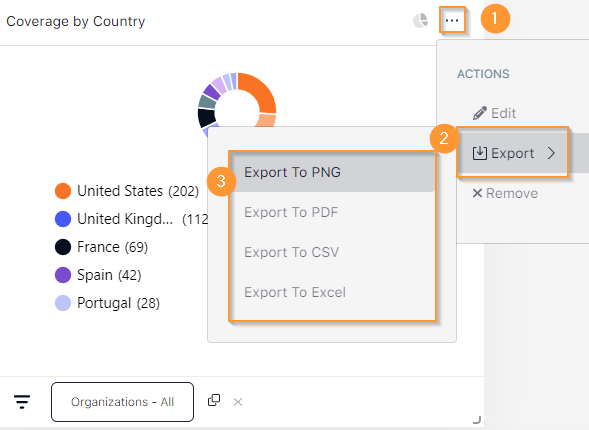
On the widget, select the menu next to the Chart Type icon and choose the file type most suitable to your needs.
For more Advanced tips check How to access and start creating Queries.